At two large pre-legislative events in the second week of January, hundreds of attendees heard Utah's Senate President proudly assert that Utah was the only state that increased education funding during the pandemic.
Every year, especially around the end of every legislative session, Utah's political leaders proclaim that they are putting record amounts of funding into education.
Unfortunately, these claims are contradicted by the data published by the Utah State Board of Education in its Superintendent's Annual Report.
Real FY21 and FY22 State + Local Education Funding Did Not Rise -- It Fell
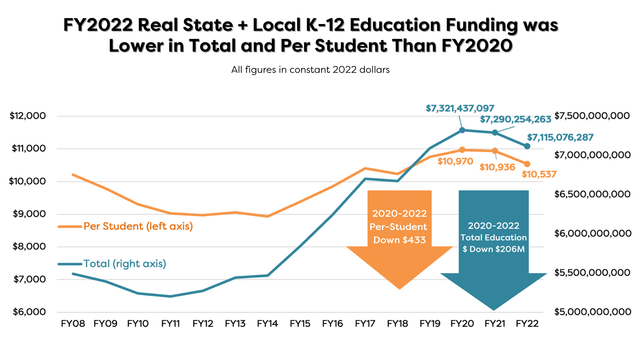
These data are from the USBE Superintendent's Annual Reports, adjusted for inflation using the standard CPI-U inflation index from the federal Bureau of Labor Statistics. They show that Utah's real (inflation-adjusted) state + local education funding fell in both FY21 and FY22, both in total and on a per-student basis. (During those two fiscal years, the Utah Legislature passed over $300 million in income tax cuts.)
State Education Funding Has Fallen While Local Education Funding Has Risen
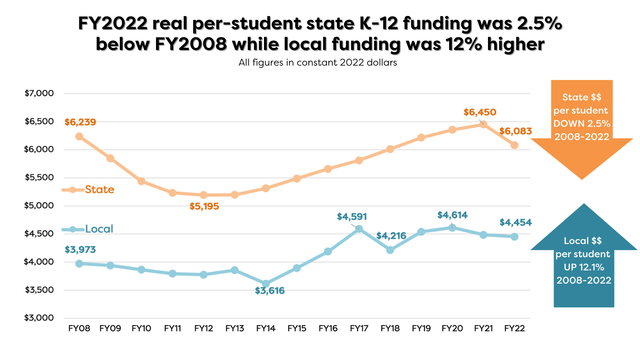
We have heard legislative leaders assert every year that they have appropriated record amounts for education. We have also sometimes heard them say that local education funding (from property taxes) has not kept up, and that is the reason that overall education funding is inadequate to reduce Utah's largest-in-the-nation class sizes or address our high rates of new teacher turnover. Yet the data from USBE show two trends that contradict these claims, as illustrated in the chart above:
- Real per-student state education funding was 2.5% lower in 2022 than in 2008 (the peak year for education funding before the Great Recession).
- Real per-student local education funding was 12% higher in 2022 than in 2008.
It is also worth noting, in this context, that permanently cutting the state income tax rate, as the Legislature has done in recent years and is considering doing once again this year, tends to put additional pressure on local property taxes to make up the difference for schools. The income tax and the property tax are the two main sources of funding for education. If policymakers intentionally and repeatedly undermine one of them, that inevitably creates pressure to increase the other (or allow it to increase naturally, as has happened the last two years with property taxes as home values have shot up).
Can We Have Record Education Funding and Record Tax Cuts?
Legislative leaders have used their incorrect claims that Utah increased education funding during the pandemic to bolster their case that Utah can have it all -- record high levels of education funding and record tax cuts. But USBE data reveal that, in fact, we cannot have it all, that tradeoffs exist, and that hard choices must be made. If we have record tax cuts, we likely will not have record levels of education funding. If we want to strengthen education finance for the long-term betterment of our children and our state, we ought to consider what we are giving up when we give in to the tax cut temptation.
One Final Comment: Inputs vs Outcomes
Needless to say, this entire discussion concerns only inputs to, not outcomes of, our K-12 public education system. But, as one superintendent wisely observed over a decade ago, "We cannot have the best school system in the country and be the lowest in the country in funding. We can't be first if we're always last."
While there is little doubt that Utah does more with less in our public schools better than probably any other state, there are several key educational outcome measures that most concern Voices for Utah Children:
- Our high school graduation rates are no higher than or below national averages for nearly every racial and ethnic category.
- Our high school graduation rate gaps between haves and have-nots and between majority and minority groups are larger than nationally.
- Our rate of college degrees, an area where Utah's older generations outpaced the nation, has fallen behind the nation's among our younger generation, the Millennial generation, based on Census data for Utahns age 25-34.
Closing these gaps and regaining our once enviable lead will require substantial new investments at every step in the pipeline, from expanding pre-K and full-day kindergarten options to reducing class sizes and new teacher turnover in our elementary, middle, and high schools, to ensuring that more of our sons and daughters finish what they start at our public colleges and universities.
Note: The charts in this blog post are from Voices for Utah Children's forthcoming "Children's Budget Report 2023" that will be published in February 2023.
Both graphs are available for download here.
Methodology and Location of Data
Utah’s education funding rises each year, but so does the student population. And prices rise due to inflation, which has been worse the last year than in 40 years. So how can we judge whether education funding is really going up, as our political leaders always claim? There is one metric considered to be the gold standard for this purpose: inflation-adjusted per-student spending. To calculate this metric, you need three pieces of data. The locations of these items are detailed below:
1. State, Local, and Federal Education Spending
Source: Utah State Board of Education Superintendent’s Annual Report at www.schools.utah.gov/superintendentannualreport
Direct Document Link: Statewide Total: Revenue and Expenditures by Fund, June 30, 2022 https://www.schools.utah.gov/file/674392fc-3946-4ba2-ba19-da7f024f3fe5
Comments: In the charts above, we used the state and local education spending data
2. K-12 Student Population
Source: Utah State Board of Education Superintendent’s Annual Report at www.schools.utah.gov/superintendentannualreport
Direct Document Link: Fall Enrollment by Grade Level and Demographics, October 1, School Year 2022-2023 https://www.schools.utah.gov/file/5c8e2fac-55dc-4f0a-bf6a-6889133e4ffe
Comments: Be sure to use the fall enrollment data from the fall of the year you are analyzing. For example, for FY/SY22, use October 2021 enrollment data.
3. Inflation Index CPI-U
Source: US Bureau of Labor Statisticshttps://www.bls.gov/data/home.htm
Direct Document Link: All Urban Consumers (Current Series) (Consumer Price Index - CPI) https://data.bls.gov/cgi-bin/surveymost?cu U.S. city average, All items - CUUR0000SA0....then use “Annual Averages”
Google Sheet with all collected data, sources & formulas
https://docs.google.com/spreadsheets/d/1fTy8wKHY6Di33eRLTcM7Ce1B5Caw10sb/edit#gid=534909710