The care for the children in our state and communities can be measured by our public investment in our smallest humans. From the fiscal year 2008 to 2022, Voices for Utah Children divided all state programs concerning children into seven categories, without regard to their location within the structure of state government to quantify the level of public funding and identify trends. The seven categories are:
- K-12 Education
- Health
- Food & Nutrition
- Early Childhood Education
- Child Welfare
- Juvenile Justice
- Income Support
An appendix of our tables, sources, methodology and description of programs can be found here.
How Much We Spend
The interactive circle chart below compares how much we spend by category, program, and source of funding, just use the filter and click the category to zoom in.
-
K-12 Education makes up 92% of the state-funded portion of the Children’s Budget, while the federal-funded portion is more diversified across categories.
Spending Trends
We compare the budget to FY2008 because that was a peak year in the economic cycle before The Great Recession and all figures have been adjusted for inflation, so they are comparable across time.
- From FY2008 to FY2022, total public investment in children increased by 43%, growing much faster than Utah’s public-school enrollment (district & charter schools) by 26%, or the child population ages 0-17 by 13% from 2008-2021.
The federal share of the Children's Budget has fluctuated between 18-26% but had its biggest increase at the beginning of the Great Recession and the Covid-19 Pandemic. This is also when state funding for the Children's Budget has declined, for example real state & local K-12 education funding fell by $206 million since FY2020, the largest two-year decline since the Great Recession in 2008-2010. Several years after the Great Recession the federal share of the Children’s Budget decreased and the state share started to increase again, something that will hopefully happen again as pandemic relief funding rolls back.
Funding Sources: Federal vs. State
When the categories are disaggregated by source of funding, Food & Nutrition, Income Support, Health, and Early Childhood Education programs are mainly funded by federal sources, and Child Welfare, K-12 Education, and Juvenile Justice programs are funded mainly by state sources. And since Amendment G passed and allowed the income tax to be used to fund programs for children (in addition to K-12 and some Early Childhood Education & Nutrition Programs), the Child Welfare, Juvenile Justice, and Health categories are funded primarily by the income tax. In FY2022, 98% of Juvenile Justice, 100% of Child Welfare, and 88% of Health categories of the state funded Children's Budget were funded by the income tax totaling to $475 M.
When examining the state-funded portion of the budget since FY2008 each category has a different story.
- Juvenile Justice programs declined the most in dollar amount, $32.9 M or 28% mainly due to a reduction in correctional facility and rural programs and it also had an increase in early intervention services which advocates consider to be a goal of juvenile justice reform.
- Child Welfare programs declined by 16% or $21.8 M, mainly from the Service Delivery program which funds caseworkers to deliver child welfare, youth, and domestic violence services.
- Income Support declined 49% or $2.1 M and appears to be more cyclical, rising and falling with the Great Recession. Interestingly, the TANF grant is a mix of state and federal funds, and only a small amount goes to Income Support or cash assistance.[i]
- Food & Nutrition increased by 56% or $19.7 M due to an increase in liquor & wine tax revenues which supports the school lunch program.
- Early Childhood Education had the largest percentage increase of 109% or $42.0 M mainly from the Upstart program but increasing in every program except Child Care Assistance.
- Health has increased by 80% or $139.3 M from the Medicaid and CHIP program but also had a 58% or $12.4 M decrease in Maternal & Child Health.
- The category that has increased the most in dollar amount is K-12 Education.
K-12 Education Funding
State and local sourced funding for K-12 education increased by $1.6 billion in constant 2022 dollars from FY2008 to FY2022, but per-pupil spending only increased from $10,212 to $10,537 per student. This means that even though more is being spent in total dollars, it barely covers the increase in students during the same time.
In 1948, 100% of the income tax was allocated to public education, an increase from 75% when it was originally imposed in 1931. It was expanded in 1996 to include higher education, in 2021 to include non-education services for children and people with a disability, and may be expanded again depending on a 2024 ballot measure placed by the Utah Legislature.
The income tax rate has been reduced in 1996, 2006, 2008, 2018, 2022, and 2023. The graphs below illustrate a timeline of these changes and Utah’s total elementary and secondary public schools (district & charter) funding effort (including capital) as a percentage of personal income and rank compared to other states.
Unfortunately, the result is a downward trajectory and likely explains our second to last place in per-pupil funding in the country.[ii]
Utah's Education Funding Effort as a Percent of Personal Income
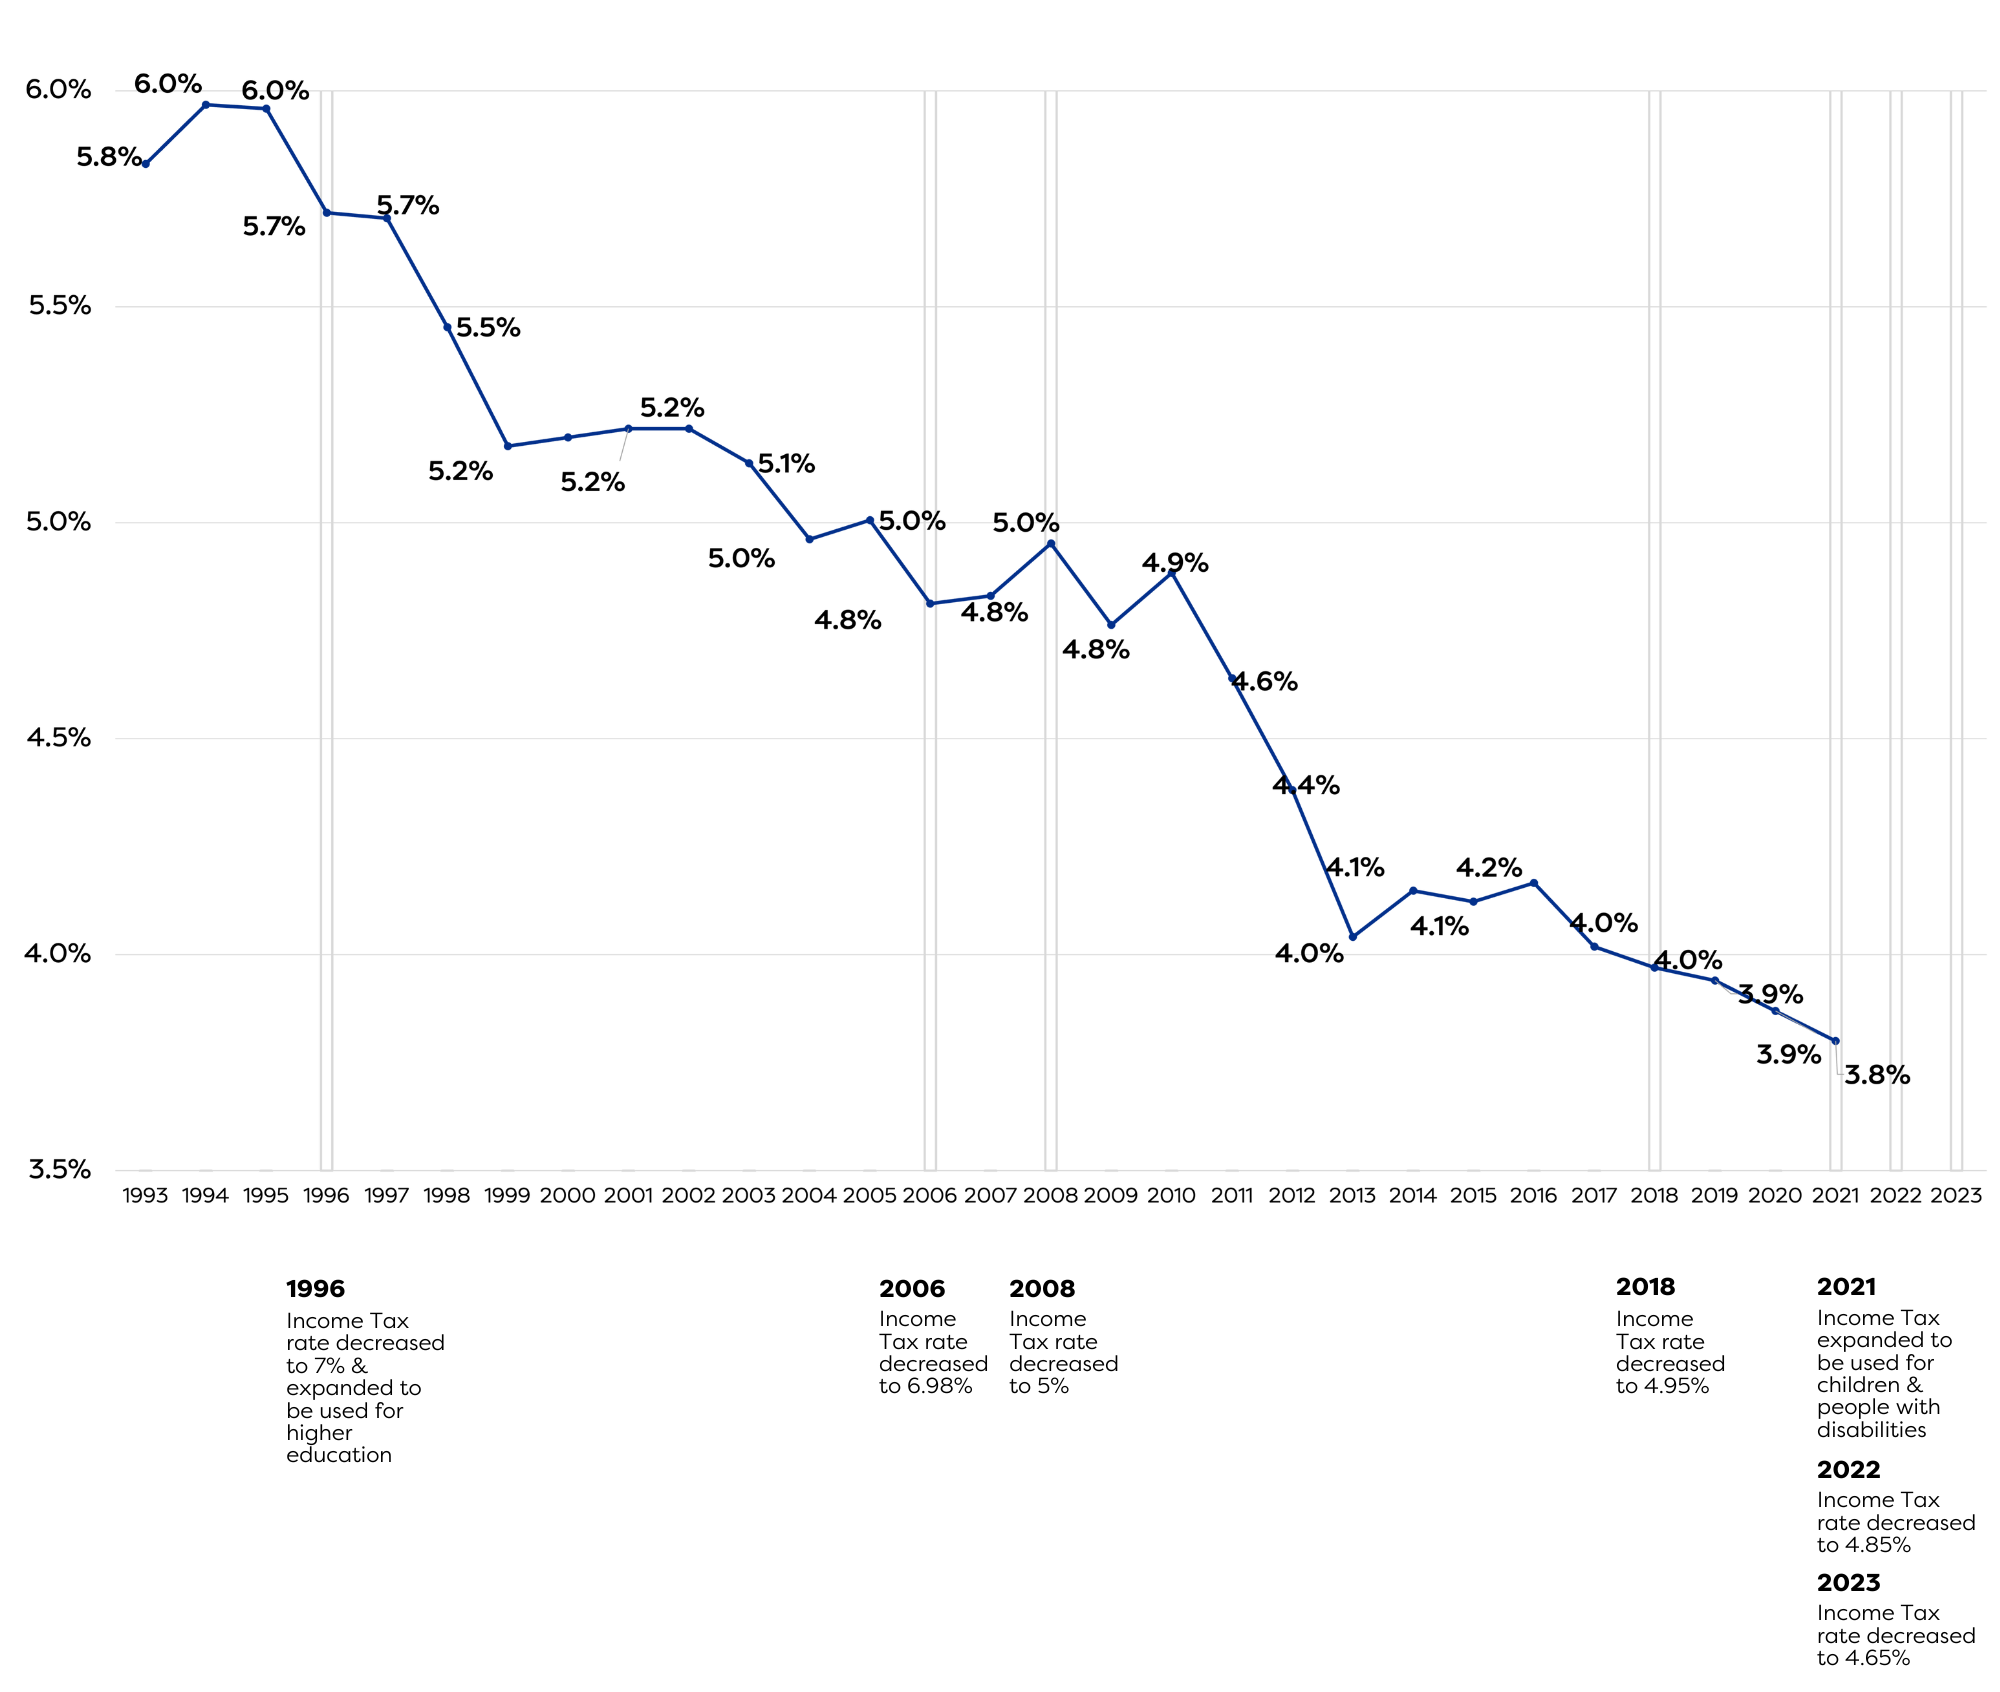
According to the fiscal notes, the last two bills that reduced the Income Tax rate in 2022 and 2023 estimated a loss of $1.3 billion in the Income Tax Fund from FY2022-2025 with more ongoing.[iii]
State & Local Funded Portion of K-12 Education
Another result of these changes has been shifts in the funding source for K-12 education. From the fiscal year 2008 to 2022, the federal-funded portion increased by 74% and the state-funded portion declined by 3%.
Meanwhile, Local sources have increased by 12%, possibly to meet the needs of their communities while state-funded sources decline and putting greater pressure on sources like the property tax which is more regressive than the income tax because it takes a greater toll on low-and middle-income families.
Rank of Utah's Education Funding Effort Compared to Other States

We Need to Prioritize Children in the Budget
While Utah doesn’t have the most kids than any other state, we do have the highest share of kids in our population. And we as a community are entrusted to make sure they are cared for, safe, and have the tools they need to achieve their aspirations. As the Utah Legislature drafts, holds hearings on, debates, and passes the Utah state budget we hope they prioritize our most vulnerable and precious group, Utah’s children.
[i] https://www.cbpp.org/sites/default/files/atoms/files/tanf_spending_ut.pdf
[ii] https://www.census.gov/programs-surveys/school-finances.html
[iii] https://le.utah.gov/~2022/bills/static/SB0059.html, https://le.utah.gov/~2023/bills/static/HB0054.html These fiscal notes show the loss from the income tax fund but they are not disaggregated by changes from the income tax rate or tax credit portion of the bills.